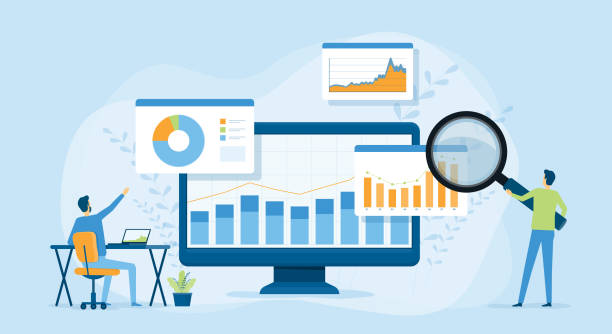
Data visualization and dashboards are essential tools for real-time data monitoring, enabling organizations to make informed decisions quickly. Here’s a breakdown of key concepts, best practices, and tools to consider:
Key Concepts
- Real-Time Data: Information that is delivered immediately after collection, allowing for timely insights and actions.
- Dashboards: Visual displays of key performance indicators (KPIs) and metrics, often using graphs, charts, and maps to provide an overview of performance at a glance.
- Data Sources: Real-time data can come from various sources, including IoT devices, social media feeds, APIs, and internal databases.
- Interactivity: Dashboards should allow users to drill down into data for deeper insights, often featuring filters and clickable elements.
Best Practices
- Define Clear Objectives: Understand what questions the dashboard needs to answer and who the target audience is.
- Prioritize Simplicity: Keep visualizations clean and uncluttered. Use appropriate chart types for the data being represented (e.g., line charts for trends, bar charts for comparisons).
- Use Consistent Design: Maintain uniformity in colors, fonts, and layouts to make dashboards user-friendly and professional.
- Incorporate Real-Time Updates: Ensure the data refreshes automatically or at regular intervals to reflect the most current information.
- Focus on Key Metrics: Highlight the most important KPIs that align with business objectives, avoiding information overload.
- Accessibility: Ensure that dashboards are easily accessible across devices and platforms, allowing for mobile access if necessary.
- User Feedback: Regularly gather feedback from users to improve the dashboard’s functionality and relevance.
Tools for Real-Time Data Visualization
- Tableau: Offers powerful visualization capabilities with real-time data integration options and user-friendly dashboards.
- Power BI: A Microsoft tool that allows for the creation of interactive reports and dashboards, with seamless integration into various data sources.
- Grafana: Primarily used for monitoring applications, it specializes in time-series data and can visualize data from multiple sources.
- Google Data Studio: A free tool that enables users to create custom reports and dashboards using data from various Google services and external sources.
- D3.js: A JavaScript library for producing dynamic, interactive data visualizations in web browsers, allowing for high customization.
- Looker: A business intelligence tool that enables data exploration and visualizations in real-time, with a strong emphasis on data governance.
Implementation Steps
- Identify Data Needs: Determine what data is necessary for monitoring and the desired outcomes.
- Select Tools and Technologies: Choose the right tools based on your organization's needs and technical capabilities.
- Data Integration: Connect various data sources to ensure a unified view of information.
- Design the Dashboard: Create wireframes and prototypes, focusing on usability and clarity.
- Testing and Iteration: Conduct testing with actual users to gather insights and refine the dashboard before full deployment.
- Training and Support: Provide training for users to maximize the dashboard's effectiveness and establish ongoing support for maintenance.
Conclusion
Effective data visualization and dashboards for real-time monitoring can significantly enhance decision-making processes within organizations. By adhering to best practices and utilizing the right tools, you can create impactful visualizations that drive actionable insights.
To learn more from related topics, please visit our website or newsletter at https://medipharmsolutions.com/newsletter/


No Comments